
Transportation Engineering — Transportation Planning
Land use, travel demand, and networks—so investment matches trips people actually make.
Introduction
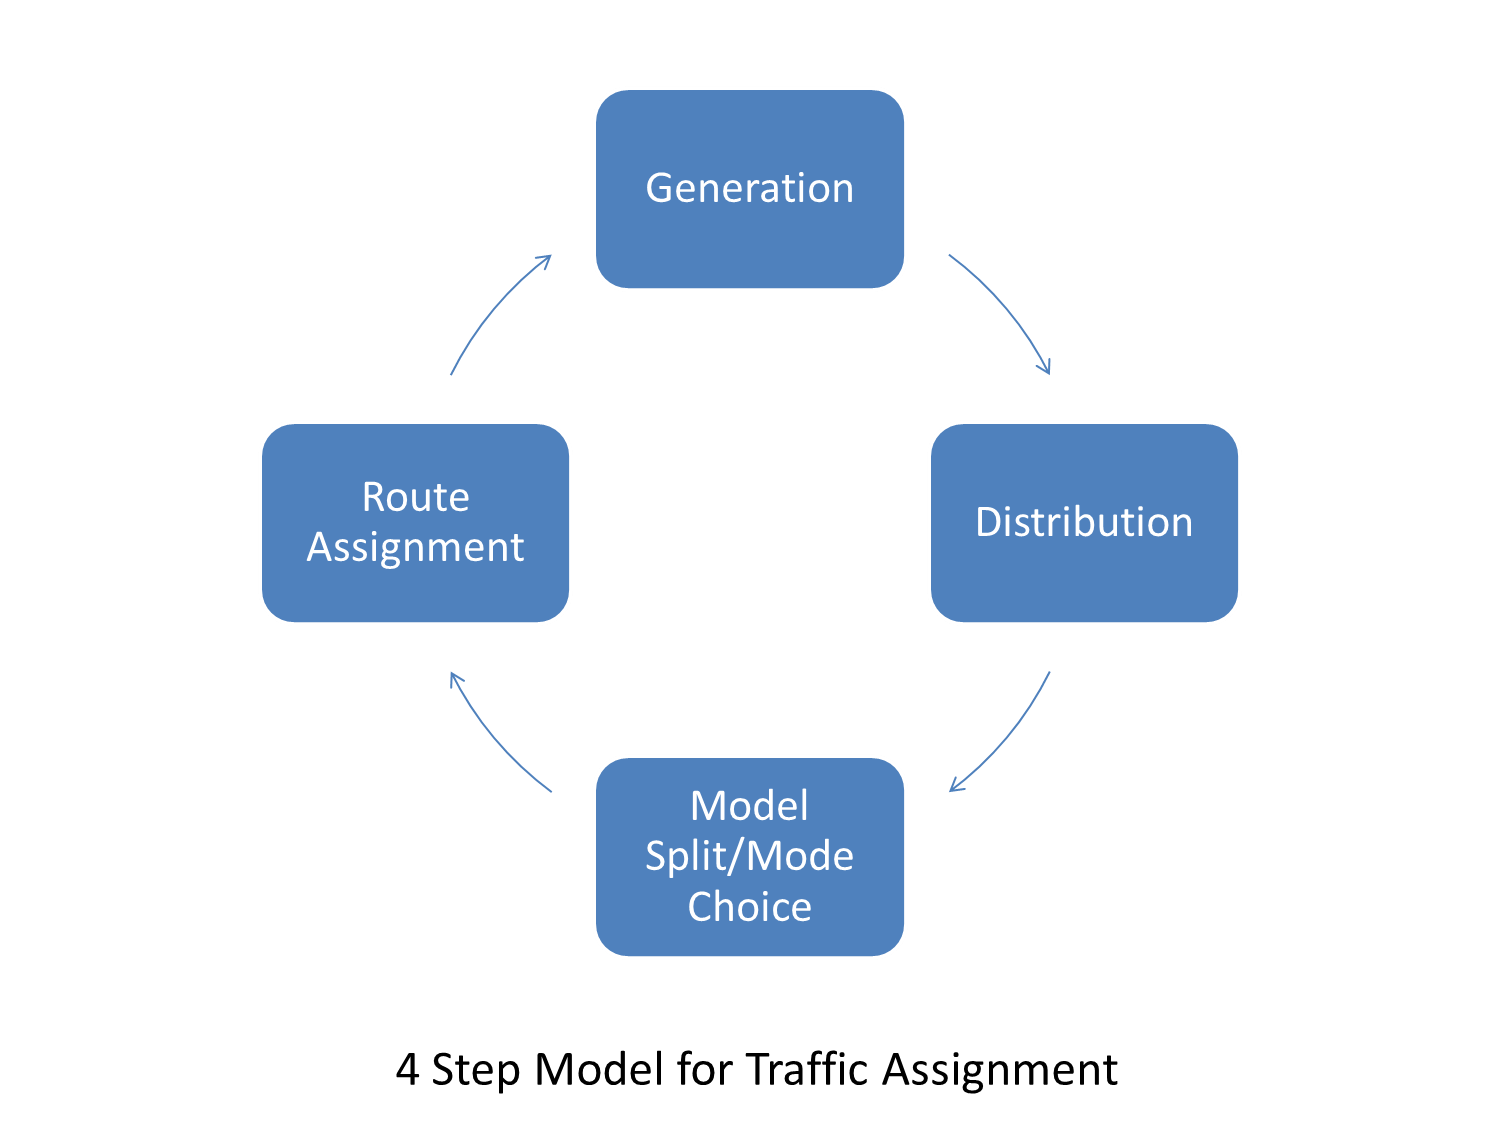
Transportation planning links people and activities to movement: how many trips occur, where they go, which modes they use, and how loads distribute on roads and transit. Classic four-step models proceed from trip generation through distribution, modal split, and traffic assignment; many regions also use activity-based or strategic tools. Policy layers—road space allocation, pricing, and non-motorised priority—affect outcomes as much as concrete and steel.


What transport planning produces
- Demand forecasts — trips, mode shares, and corridor loads for design years.
- Alternatives analysis — compare projects, TDM measures, and land-use scenarios.
- Equity and environment — accessibility, emissions, and noise screening.
- Programming — prioritised lists aligned with funding and policy.
Standards and guidance (South Africa)
Studies typically align with municipal or provincial transport plans, National Land Transport Act processes where applicable, and project-specific terms of reference. Coordinate with traffic engineering for operational detail and environmental specialists for EIA needs—this page does not replace a full travel-demand model sign-off.
Notation (common)
- PA / productions–attractions — trips leaving or entering a zone.
- OD matrix — origin–destination flows between zones.
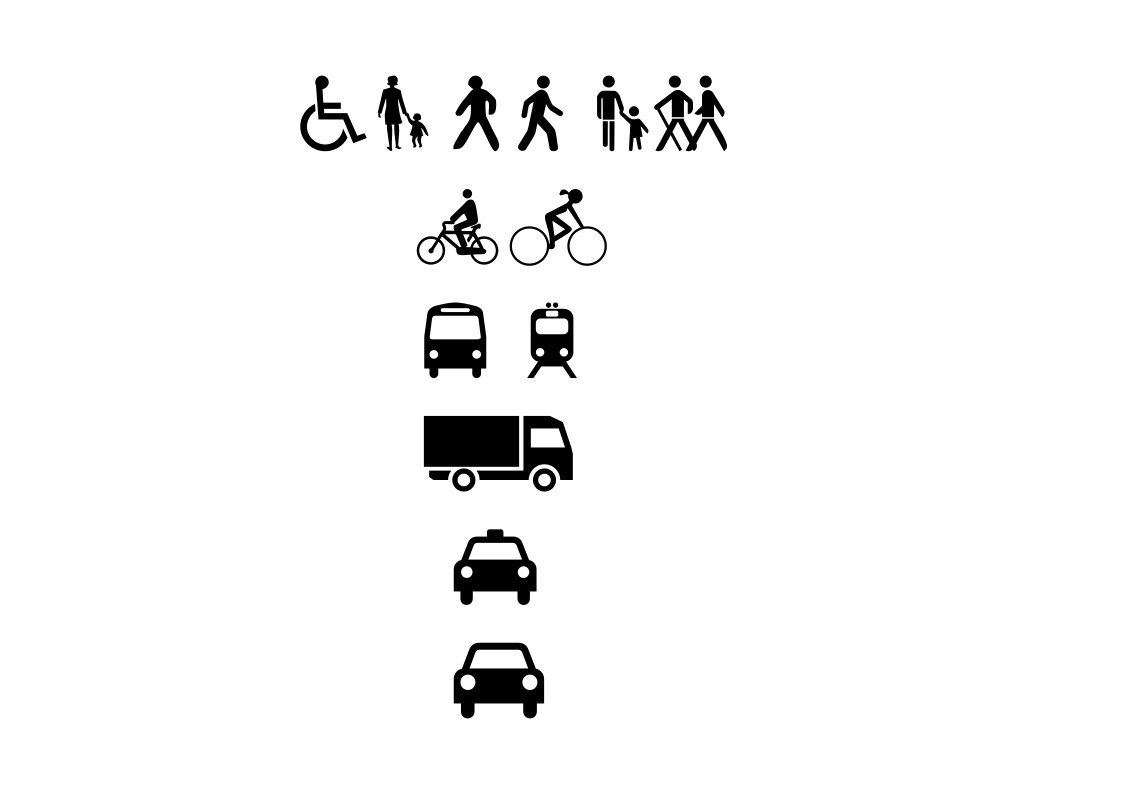
- Modal split — share of trips by walk, cycle, transit, or car.
- LOS — level of service (often used after assignment to links).
Examples in practice
- Greenfield township: trip generation from dwelling counts and land-use categories.
- CBD cordon: peak-hour person trips and public transport capacity.
- Freight corridor: heavy-vehicle OD and pavement / geometric implications.
- Transit line: ridership forecasts and park-and-ride catchments.
Calculator — trip generation (illustrative)
Enter a count of population or dwelling units and a trip rate (trips per unit per day). Output is their product—use only as a sanity check alongside proper trip generation models.
Daily trips
Illustrative daily trip total ≈ (population or dwelling units) × (trips per unit per day).
Key terms
- Trip generation
- Trips produced or attracted by a zone as a function of land use and activity.
- Trip rate
- Trips per household, person, or floor area—taken from surveys or manuals for the study context.
Software and travel-demand modelling
Network building, matrices, and scenario testing use commercial or open tools. Examples (official sites):
- PTV Visum — macroscopic multi-modal demand and assignment.
- Citilabs Cube — travel demand modelling and network analysis.
- Emme — transportation planning and modelling (INRO).
- TransCAD — GIS-based transportation planning (Caliper).
No product endorsement—model structure, calibration data, and validation must match your terms of reference and governance requirements.
Diagram sources
Educational figures. Files in Images/transportation-planning/ were downloaded from Wikimedia Commons into this repo (not copied from other topic folders). Confirm licence on each Commons file page before reuse.