
Construction / Project Engineering — Risk & Productivity Analysis
Identify risks to cost and schedule; quantify expected impact and productivity loss.
Introduction
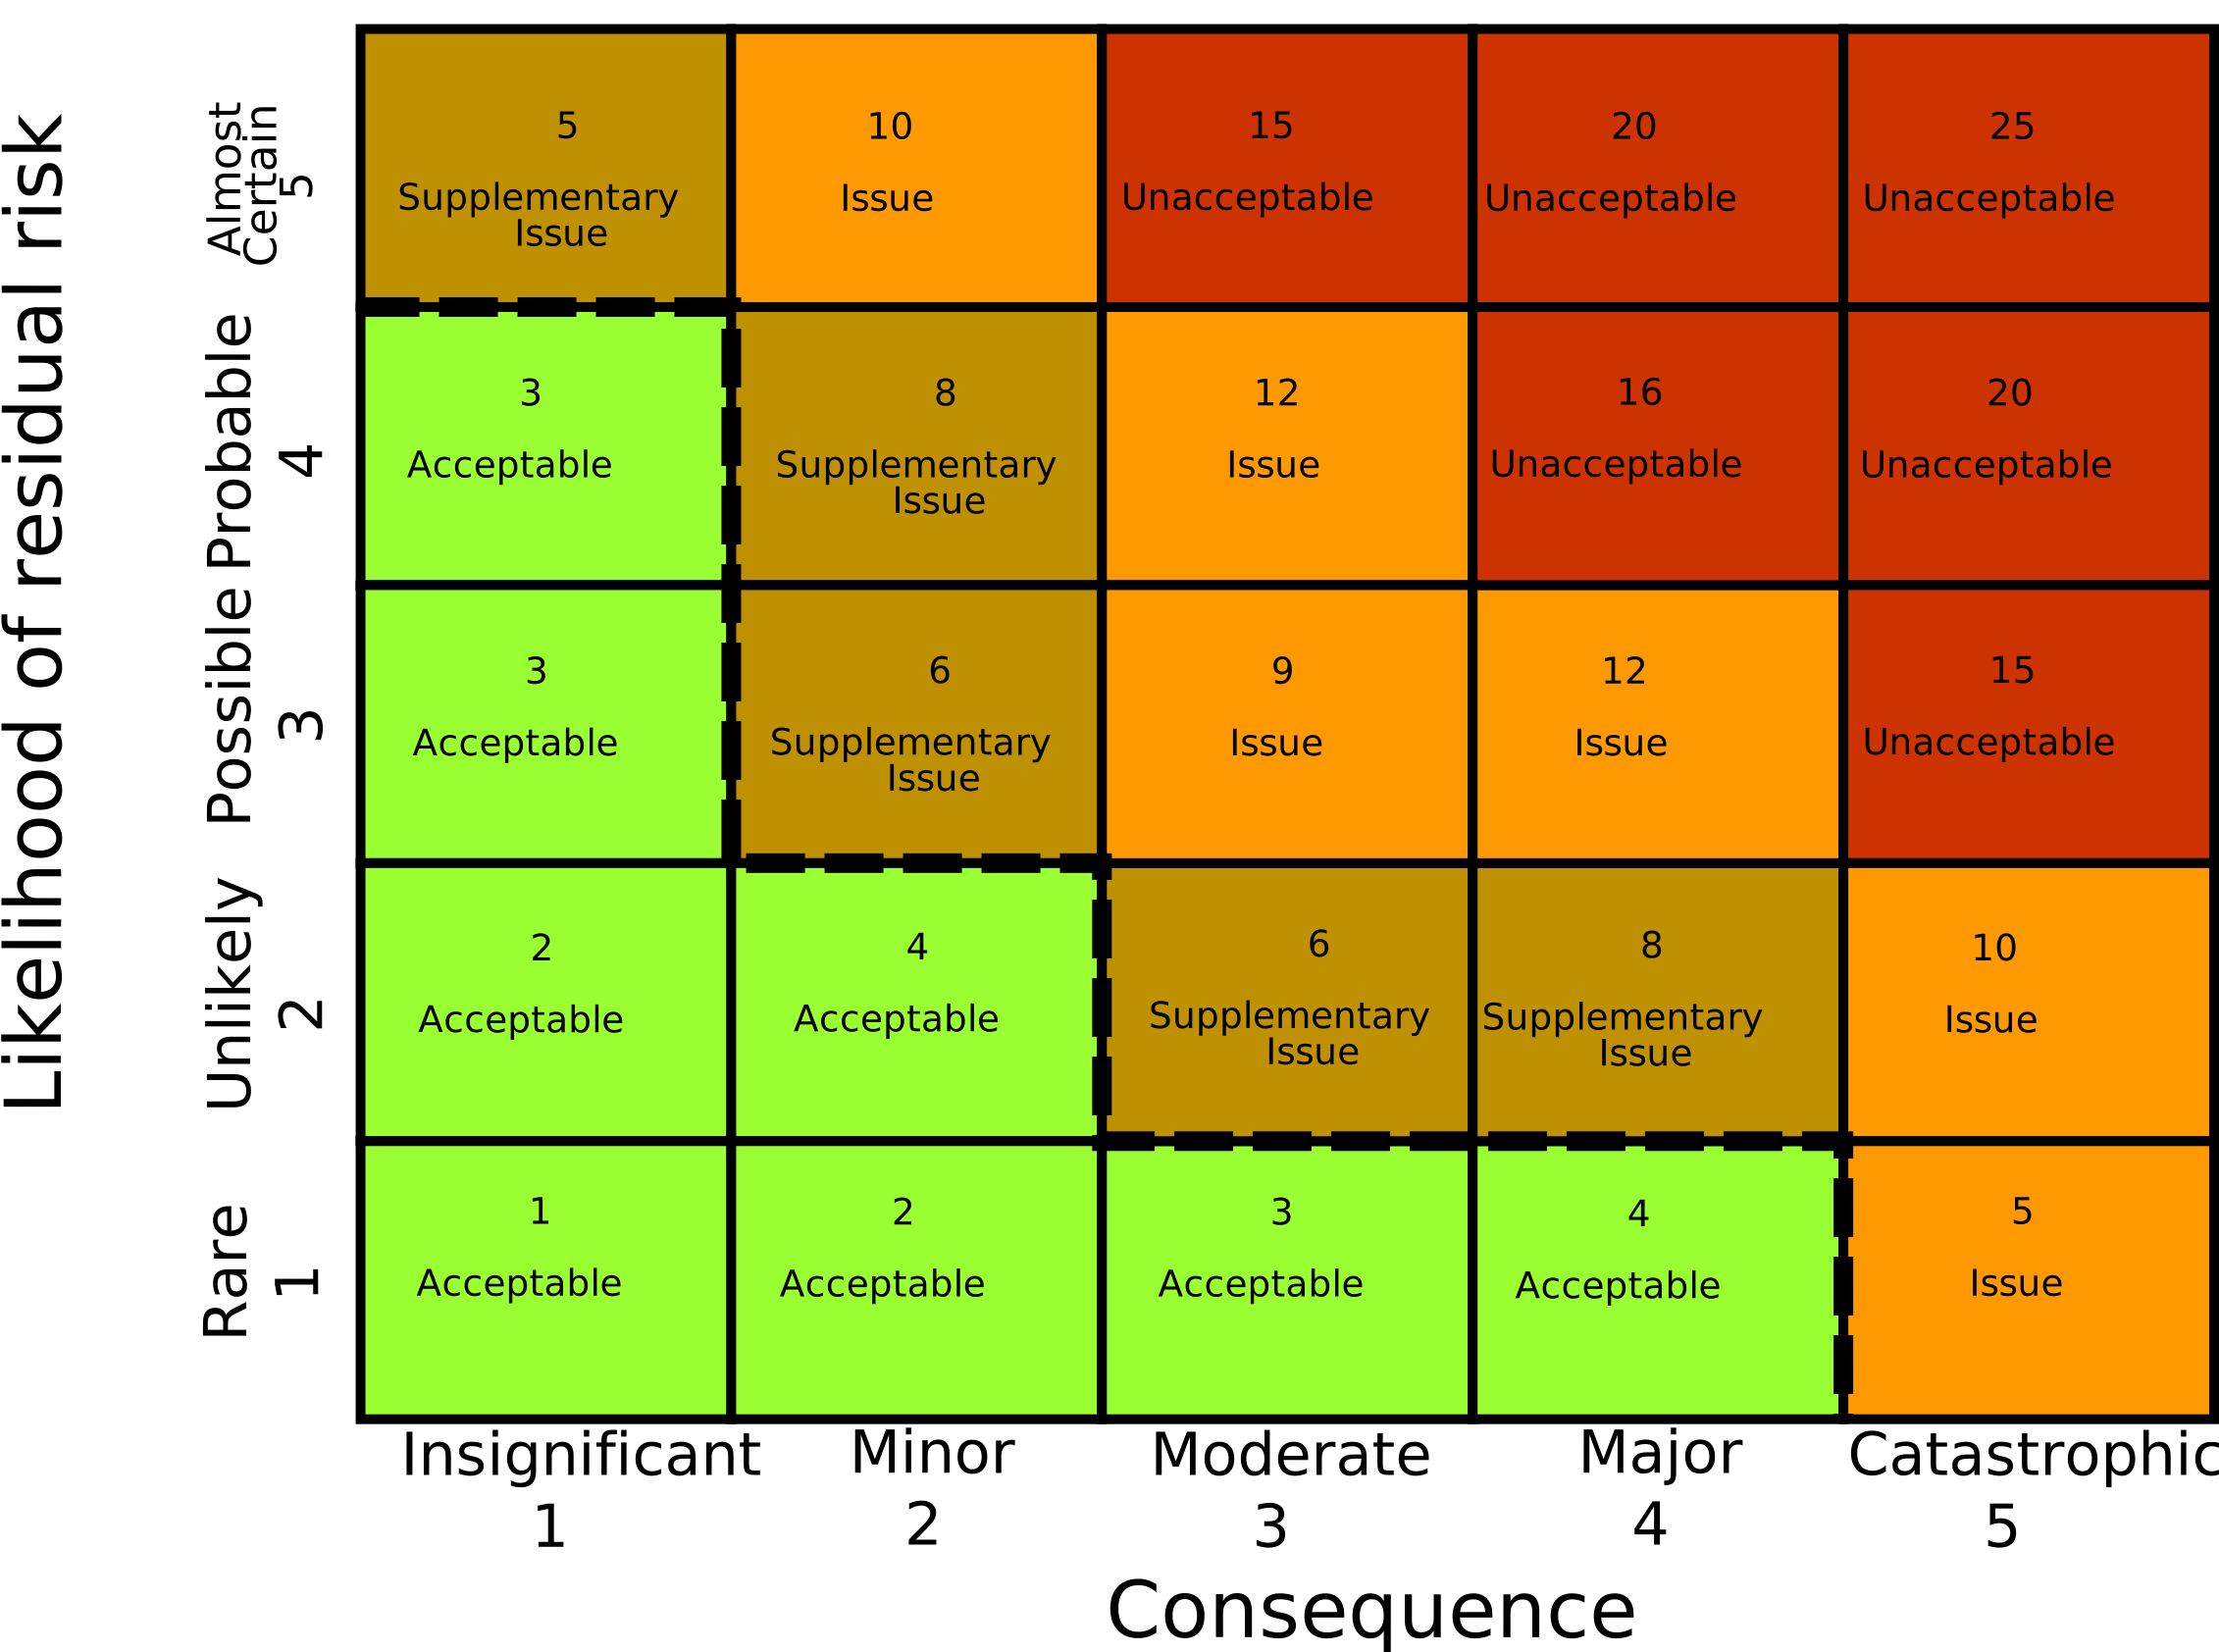
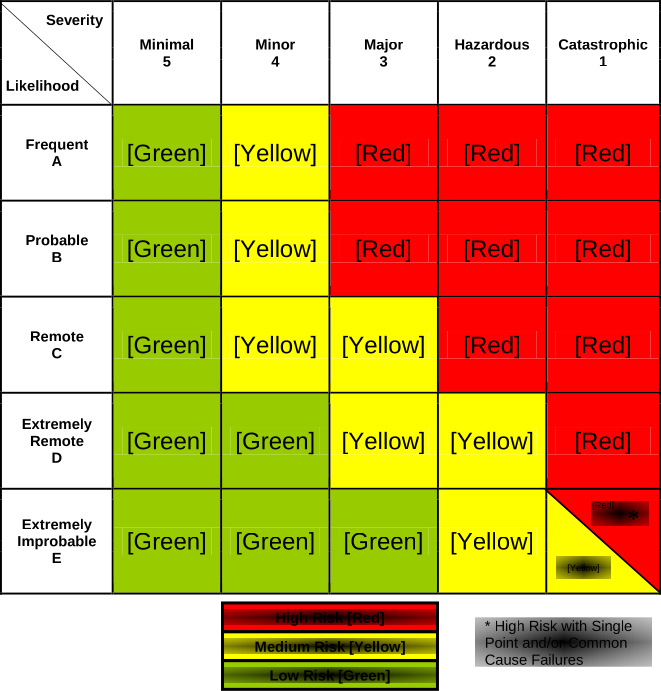
Risk analysis prioritises what might push the project off baseline. A risk matrix maps likelihood and severity; EMV multiplies probability by monetary impact for a quick expected cost of uncertainty. Productivity analysis compares planned vs earned output—delays, crowding, and changes often show up as loss of productivity (LOP) in claims and forensic schedules.


Expected monetary value
EMV = P × impact when a single outcome is assumed (useful for screening). For correlated risks or ranges, teams use tornado charts, Monte Carlo, or scenario analysis. Productivity shocks can be modelled as cost and time distributions on affected activities.
Productivity and disruption
Track planned productivity (output per day or hour) against actual on the same basis. Disruption, out-of-sequence work, and overtime can reduce efficiency even when hours increase. Good records—daily diaries, manhour books, and as-built schedules—support both mitigation and claims.
Contracts and context (South Africa)
Risk allocation (e.g. ground conditions, weather thresholds, employer-supplied information) is defined in the particular conditions. Understand notices, early warnings, and compensation routes before you lock a register. Align HSE risk assessments with the project’s legal and insurance requirements.
Examples in practice
- Weather: probability of lost days × standby or acceleration cost.
- Supply chain: material escalation or late delivery impacting critical activities.
- Interfaces: late handover of workfaces → trade stacking → productivity loss.
- Design changes: rework, waiting time, and resequencing costs.
Calculator — expected monetary value
Enter P between 0 and 1 and a single impact amount in currency (or normalised units). Output is EMV = P × I.
EMV
Expected monetary value EMV = probability × impact for a single-outcome risk screen.
Key terms
- Expected monetary value
- Probability-weighted impact for screening risks.
- Mitigation
- Actions that reduce P, I, or both—update the register when they are implemented.
Software and quantitative risk
Registers and models range from spreadsheets to integrated platforms. Examples (official sites):
- Oracle Construction & Engineering — programme and risk integration (e.g. Primavera suite).
- Palisade — @RISK and decision tools for Monte Carlo in Excel.
- Bentley SYNCHRO — 4D planning with schedule risk context.
- Procore — field and financial tracking with change and risk workflows.
No product endorsement—match tools to your governance, data security, and audit requirements.
Diagram sources
Educational figures. Files in Images/risk-productivity-analysis/ were downloaded from Wikimedia Commons into this repo (not copied from other topic folders). Confirm licence on each Commons file page before reuse.