
Construction / Project Engineering — Progress Tracking & Reporting
Measure physical and financial progress against the baseline schedule and budget.
Introduction
Progress tracking answers whether the project is where it should be at a given date: physically, financially, or both. Reporting packages that answer for the employer, funders, and the project team—often with S-curves, tabular period data, and photographs. Earned value management (EVM) links scope, schedule, and cost so variances are visible early.



What progress tracking delivers
- Variance visibility — schedule slip and cost overrun vs baseline, by WBS or package.
- Forecast realism — EAC and completion date based on trends, not hope.
- Payment alignment — measured work tied to certificates and cash flow.
- Claims discipline — contemporaneous records if disruption or delay is disputed.
Earned value basics
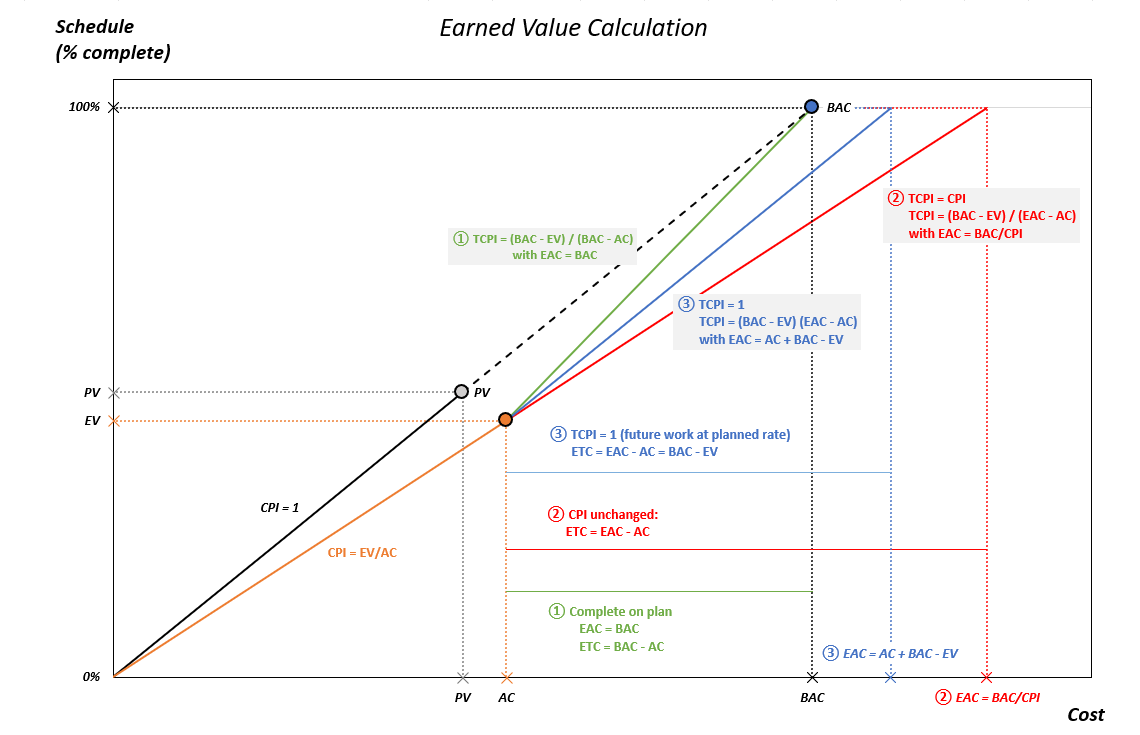
BCWS (planned value), BCWP (earned value), and ACWP (actual cost) let you compute CPI and SPI. The simple calculator below is physical % complete only; full EVM uses currency and time-phased baselines from your cost loaded schedule.
Contracts and reporting (South Africa)
Align reporting with the contract data, payment terms, and any employer’s or principal agent’s templates. JBCC and NEC families (where used) have different terminology for notices, programmes, and compensation events—use the definitions in your agreement. Keep records that support both monthly reporting and potential dispute timelines.
Examples in practice
- Earthworks: m³ placed vs planned m³ per month; reconcile survey and truck counts.
- Structure: floor area cast vs programme; link to formwork cycles and concrete supply.
- MEP: workface cleared vs services installed; coordination milestones in the schedule.
- Finishes: rooms signed off vs area in BoQ; snag lists vs practical completion.
Calculator — percent complete
Enter done and total in the same units (e.g. m², units, or a single line’s scope). Output is physical % complete.
Physical completion
Physical percent complete = (quantity done ÷ total quantity) × 100%.
Key terms
- Earned value
- Budgeted cost of work performed (BCWP) compared to planned and actual.
- BCWS / BCWP
- Planned value vs earned value for the same cut-off date.
Software and progress control
Scheduling, cost, and field tools often share a single baseline. Examples (official sites):
- Oracle Construction & Engineering — Primavera P6 and cloud programme/cost suites.
- Microsoft Project — desktop scheduling and portfolio integration.
- Procore — field progress, drawings, and financial tools.
- Autodesk Construction Cloud — model-linked quantities and site workflows.
No product endorsement—use what your contract and employer mandate; exports and audit trails matter for claims.
Diagram sources
Educational figures. Files in Images/progress-tracking-reporting/ were downloaded from Wikimedia Commons into this repo (not copied from other topic folders). Confirm licence on each Commons file page before reuse.