
Transportation Engineering — Traffic Engineering
Flow, speed, density, capacity, and control—how vehicles use roads and intersections.
Introduction
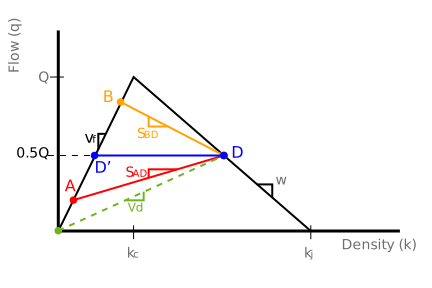
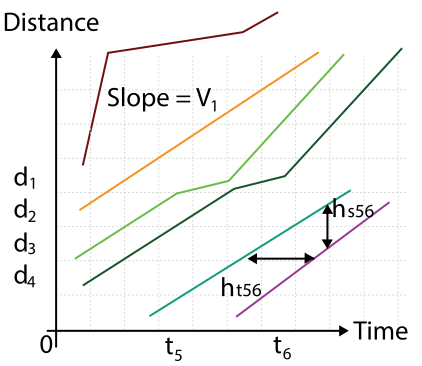
Traffic engineering applies fluid-like relations on links: flow q, density k, and speed v are related by q = k v under steady conditions. Fundamental diagrams plot q–k or v–k; bottlenecks and shock waves appear when demand exceeds capacity or lanes drop. Intersections add delay and queues analysed with gap acceptance, signal timing, or microsimulation.
The calculator below solves for v given q and k; it does not replace capacity analysis or signal optimisation.


What traffic analysis produces
- Capacity and level of service for links and weaving areas.
- Delay and queue length at signalled and unsignalised intersections.
- Design hour volumes and turning movements for geometric design.
- Input to safety and operations studies (speed management, ITS).
Standards and guidance (South Africa)
National roads: SANRAL geometric and traffic guidance (TRH documents as cited). Provincial and municipal roads: COLTO and local by-laws. Development projects: municipal traffic impact assessment requirements. Align assumptions with the transport planning memo and counted volumes.
Notation (common)
- q — flow rate (veh/h per lane typical).
- k — density (veh/km per lane).
- v — space mean speed (km/h when q and k use the above).
- LOS — level of service (quality of traffic conditions, method-specific).
Examples in practice
- Freeway merge: demand vs capacity before and after auxiliary lane.
- Urban arterial: coordinated signal timing for a corridor.
- Roundabout: entry capacity vs circulating flow.
- Work zone: temporary lane drop and queue warning distances.
Calculator — q = k v
Enter q (veh/h per lane) and k (veh/km per lane), k > 0. Output v = q/k in km/h.
Mean speed
Space mean speed v = q/k from lane flow q and density k (steady uniform flow).
Key terms
- Flow (q)
- Vehicles passing a point per unit time per lane.
- Density (k)
- Vehicles per unit length of roadway per lane.
Software and traffic analysis
Microsimulation and analytical tools model networks, signals, and priority intersections. Examples (official sites):
- PTV Vissim — multi-agent traffic simulation.
- Synchro Studio — intersection analysis and signal timing (Trafficware).
- Citilabs Cube — travel demand and network modelling.
- SIDRA Solutions — intersection capacity and performance.
- Autodesk Civil 3D — civil design with vehicle path and corridor tools.
No product endorsement—calibrate models to local driver behaviour, heavy-vehicle share, and approved growth factors. The q–k–v calculator is a link-level spot check only.
Diagram sources
Educational schematics. Files in Images/traffic-engineering/ were downloaded from Wikimedia Commons into this repo (not copied from other topic folders). Confirm licence on each Commons file page before reuse.