
Structural Engineering — Life Cycle & Inspection
Handbook Ch. 36—maintenance, aging, and inspections tied to life-cycle evaluation and condition assessment.
How this page relates to Chapter 36
Chapter 36 — Life cycle evaluation & condition assessment covers asset management, deterioration modelling, inspection planning, and reliability-based assessment—far more than a short web summary. What follows is a theme list; the two calculators are screening toys (linear strength decay, MTBF from constant hazard).
Illustrations (deterioration)
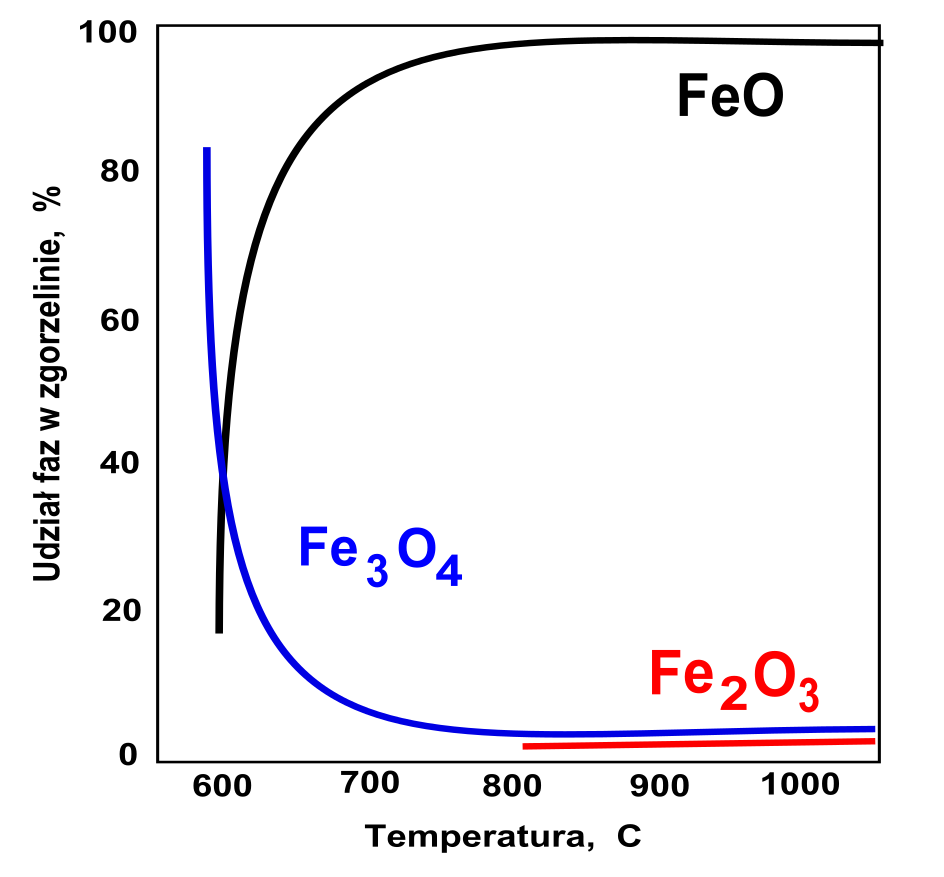
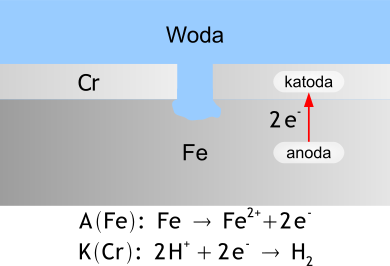
Corrosion and high-temperature oxidation drive section loss and durability decisions on steel and coatings—highly simplified by the diagrams below.


What life-cycle and inspection produce
- Condition grades — Rated observations tied to photos, NDT, and load-capacity estimates.
- Intervention plans — Repair windows, strengthening schemes, and budget forecasts.
- Risk registers — Updated failure probabilities when inspection data is incorporated.
Standards and owner practice
National bridge inspection manuals, industrial asset standards, and owner engineering rules often exceed generic building codes. Align remaining capacity with the assessment standard cited in the contract (e.g. bridge load rating or structural reliability annexes).
Notation (on-page calculators)
- Strength decay — f0 initial relative strength; α loss rate per year; t time (years); fn degraded strength factor.
- MTBF — λ hazard rate (1/year); MTBF = 1/λ (simple random-failure model).
Introduction
Design sets nominal lives and durability assumptions; reality is corrosion, wear, fatigue cracking, foundation movement, and changed use. Condition assessment turns site observations, tests, and history into decisions on repair, strengthening, or replacement—often with reliability and economic risk framing.
Chapter 36 — Life cycle evaluation & condition assessment (handbook scope)
Themes
- Life-cycle costing — Initial vs maintenance vs failure-risk costs; discounting and intervention timing.
- Deterioration — Models for corrosion rate, cracking, loss of section; updating with inspection data (Bayesian methods in advanced practice).
- Inspection — Visual, NDT, monitoring; risk-based inspection intervals; access and baseline records.
- Assessment — Load rating, remaining capacity, retrofit design; often parallel to bridge or industrial asset codes and owner standards.
Chapter 36 — calculators (screening)
Linear strength degradation model and mean time between random failures from a constant hazard rate—teaching only.
Calculator — degraded strength factor
Aging multiplier (illustrative)
Linear residual strength factor fn = f0(1 − αt) vs time (screening model).
Calculator — MTBF from hazard rate
Random failure model (screening)
Mean time between failures MTBF = 1/λ for a constant hazard rate λ.
Software and asset management
Inspection data, digital twins, and reliability updates are often managed in asset information systems. General structural tools still help re-analyse rated members. Examples (official vendor sites):
- SAP2000 — re-analysis of as-inspected structural models.
- STAAD.Pro — analysis and design workflows.
- RFEM — FEA for refined capacity checks.
- Autodesk Revit — BIM for as-built documentation.
No endorsement—owner inspection manuals and regulator rules define acceptable methods for each asset class.
Diagram sources
Educational schematics. Files in Images/life-cycle-inspection/ from Wikimedia Commons.
- Iron oxides.svg — Joanna Kośmider; gas corrosion schematic.
- Corrosion Cr-coated Fe polish labels.svg — Winiar; coated steel corrosion.