
Transportation Engineering — Traffic Safety & Operations
Understand crash patterns and exposure; manage operations so roads stay safe under real traffic.
Introduction
Road safety engineering addresses human behaviour, vehicle factors, and the road environment (speed, layout, visibility, protection). Operations covers recurring congestion, incidents, signals, and ITS—where throughput and reliability interact with conflict points. Crash analysis uses exposure (e.g. traffic volumes, distance travelled) so simple counts are interpreted in context; surrogate measures such as conflicts support proactive design before crashes accumulate.
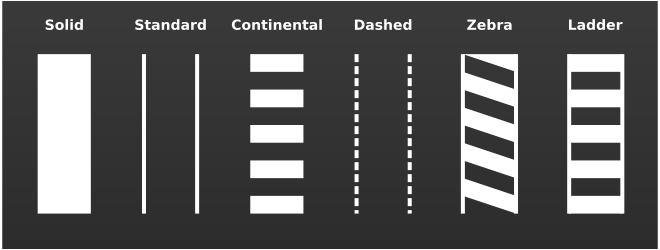
.svg)
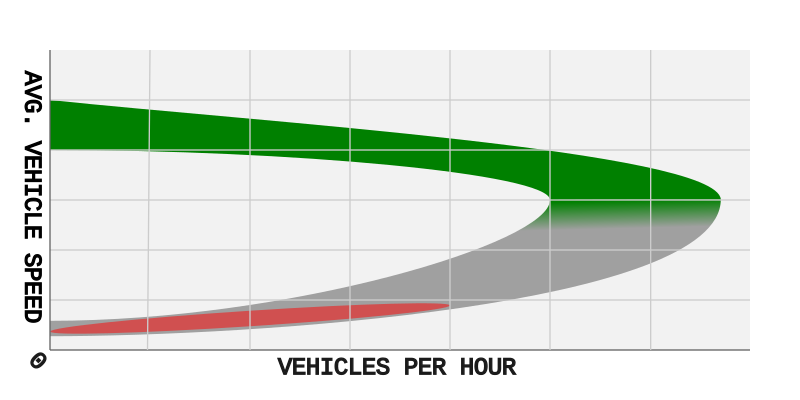

What safety & operations studies deliver
- Diagnosis — crash types, locations, and contributing factors linked to geometry and control.
- Countermeasures — proven treatments (signing, speed management, junction design) with expected effectiveness ranges.
- Operations plans — incident response, signal coordination, and demand management.
- Monitoring — before/after or network safety performance indicators.
Standards and guidance (South Africa)
Road safety aligns with national and provincial programmes, SANRAL and municipal road safety initiatives, and project-specific RSA requirements. Traffic signs and markings follow SADC / national standards where cited in contracts. Always match analysis methods to the data dictionary used for crash reporting and exposure.
Notation (common)
- n — crash count in the study period (severity filter as defined).
- Y — exposure; here M veh-km/yr on the segment or network.
- SPF — safety performance function (expected crashes for facility type).
- CMF — crash modification factor for a treatment.
Examples in practice
- Rural curve: run-off-road crashes vs speed and shoulder width.
- Urban signalised intersection: right-angle and pedestrian crashes vs timing and visibility.
- Motorway weaving section: sideswipe and rear-end patterns vs length and demand.
- School zone: speed compliance and crossing treatments before/after.
Calculator — crash rate
Enter crash count n and annual exposure Y in million vehicle-km per year (M veh-km/yr). Output is n/Y crashes per M veh-km.
Crashes per exposure
Crash rate n/Y with exposure Y in million vehicle-km per year (screening ratio).
Key terms
- Conflict
- Event where paths intersect such that collision is possible without evasive action—used in proactive analysis.
- Exposure
- Opportunity for crashes (e.g. travel, junction throughput); must be defined consistently for comparison.
Software and safety analysis
Road safety assessment, intersection review, and crash data tools vary by country and licence. Examples (official sites):
- iRAP — International Road Assessment Programme (star ratings and assessment tools).
- PTV Vistro — intersection and priority control analysis (operations and safety context).
- CMF Clearinghouse — crash modification factors for countermeasures (US-led resource).
- ArcGIS Pro — mapping crash locations, hot spots, and exposure layers.
No product endorsement—select methods and data sources required by your client, road authority, and legal reporting framework.
Diagram sources
Educational figures. Files in Images/traffic-safety-operations/ were downloaded from Wikimedia Commons into this repo (not copied from other topic folders). Confirm licence on each Commons file page before reuse.